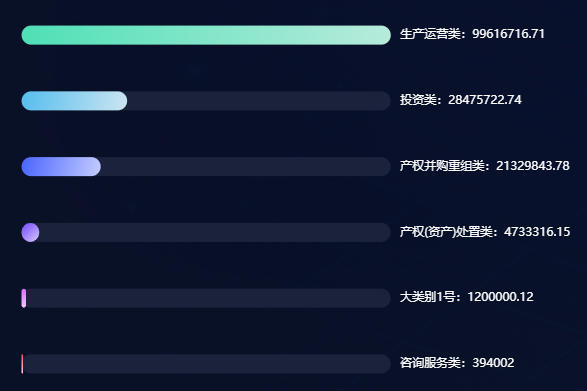
{
	title: {
		text: 'World Population',
		show: false,
	},
	tooltip: {
		trigger: 'axis',
		axisPointer: {
			type: 'shadow'
		},
		formatter: function (params) {
			return params[0].name + '<br/>'
		}
	},
	legend: {
		show: false,
	},
	grid: {
		left: '1%',
		right: '1%',
		bottom: '1%',
		top:"1%",
		containLabel: true
	},
	xAxis: {
		show: false,
	},
	yAxis: {
		type: 'category',
		data: this.chartData.columnarData.label,
		axisTick: {show: false},
		axisLine: {show: false},
		axisLabel:{
			color:"#fff",
			show: true,
		},
		position: 'right',
	},
	series: [
		{
			name: '',//系列名称
			type: 'bar',//柱状、条形图
			barWidth: 19,//柱条的宽度,默认自适应
			data: this.chartData.columnarData.value,//系列中数据内容数组
			label: { //图形上的文本标签
				show: false,
			},
			itemStyle: {//图形样式
				normal: {
					barBorderRadius: 10,
					color:  function(params) {
						let colorList = [
							['#FF516D', '#FFD1D9'],
							['#DF67F5', '#F4C7FC'],
							['#7245FF', '#D6C9FF'],
							['#4964FF', '#C4CDFF'],
							['#56BDED', '#CBE5F1'],
							['#4EE0B6', '#B7EBDC'],
							['#6AE34C', '#CAF3C0'],
							['#FFD140', '#FFEEBA'],
							['#FA8941', '#FED1B4'],
							['#FF2B2B', '#FFC4C4']
						]
						let index = params.dataIndex;
						if(index >= colorList.length){
							index = params.dataIndex - colorList.length;
						}
						return new echarts.graphic.LinearGradient(0,0,1,1, [
							{
								offset: 0,
								color: colorList[index][0]
							},
							{
								offset: 1,
								color: colorList[index][1]
							}
						])
					},
				}
			},

			zlevel:1//柱状图所有图形的 zlevel 值,
					//zlevel 大的 Canvas 会放在 zlevel 小的 Canvas 的上面
		},
		{
			name: '',
			type: 'bar',
			barGap: '-100%',//不同系列的柱间距离,为百分比。
			// 在同一坐标系上,此属性会被多个 'bar' 系列共享。
			// 此属性应设置于此坐标系中最后一个 'bar' 系列上才会生效,
			//并且是对此坐标系中所有 'bar' 系列生效。
			barWidth: 19,
			data: [99584716.71, 99584716.71, 99584716.71,99584716.71, 99584716.71, 99584716.71],
			color: '#1B233C',//柱条颜色
			itemStyle: {
				normal: {
				barBorderRadius: 10
				}
			}
		}
	]
}
柱状图仿进度条


